X-Ray Financial Analytics: From Months to Minutes with Databricks and Sigma
Summary
- Hospital for Special Surgery (HSS), ranked number one in orthopedics by US News and World Report for 16 consecutive years, reduced its monthly financial close from months to days by building X-Ray, a unified financial analytics platform on Databricks and Sigma.
- X-Ray replaces an Outlook-and-Excel-based workflow by ingesting data from Workday (ERP) and Epic (EMR) into a medallion architecture, creating a single source of truth for income statements, cash flow, and balance sheet analysis.
- Dynamic drill-downs connect financial metrics directly to operational drivers such as labor costs and surgical volume, shifting decisions from meetings and investigations to immediate, data-driven action.
X-Ray Financial Analytics: From Months to Minutes with Databricks and Sigma
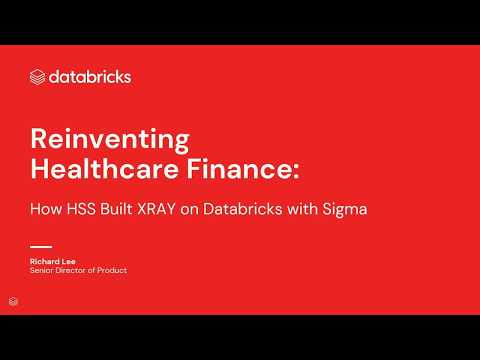
Hospital for Special Surgery (HSS), ranked number one in orthopedics for 16 years, reduced its monthly financial close from months to days by building X-Ray, a unified financial analytics platform on Databricks and Sigma. The solution connects fractured financial and operational systems through a medallion architecture, ingesting data from Workday (ERP) and Epic (EMR) to create a single source of truth.
Learn how HSS transformed from a siloed Excel-based workflow to real-time income statements, cash flow, and balance sheet analysis. Discover the data modeling strategy of full ERP ingestion upfront, how a cross-functional pod model brought finance users and data teams together, and how dynamic drill-downs connect financial metrics to operational drivers like labor costs and surgical volume. See how exposing integrated data led to actionable insights that shifted decisions from meetings and investigations to immediate, data-driven action.
🤝
Chapters
00:00Introduction and HSS Profile: Number One in Orthopedics01:42The Challenge: From Workflow of Doom to Real-Time Finance03:03Technical Foundation: Databricks with Medallion Architecture04:06Organizational Model: Cross-Functional Pod and Product Thinking04:37Building X-Ray: Live Income Statement and Operational Data06:11Data Model Design: Full ERP Ingestion Upfront07:13User Experience: Dynamic Filtering, Drill-Downs and Glossary09:49Launch and Early Wins: Table Stakes Reporting Delivered11:08Higher-Order Impact: From Reporting to Actionable Insights13:14The Future: AI Context, Analysis and Autonomous Action14:20Credits and Partners
FAQs
What is X-Ray and why did Hospital for Special Surgery build it?
X-Ray is a unified financial analytics platform built on Databricks and Sigma that HSS developed to replace a fragmented, Excel-based financial workflow the team called the workflow of doom. The platform name mirrors X-ray imaging: just as medical X-rays reveal the inner workings of patients, X-Ray reveals the inner workings of the organization's finances.
How does X-Ray integrate financial and operational data at HSS?
X-Ray ingests data from Workday for ERP and Epic for EMR into a medallion architecture on Databricks, creating a single source of truth for income statements, cash flow, and balance sheets. Dynamic drill-downs then connect financial metrics directly to operational drivers such as labor costs and surgical volume, enabling users to trace financial outcomes to their root causes.
What data modeling strategy did HSS use when building X-Ray?
HSS chose to perform a full ERP ingestion upfront rather than selectively loading tables, establishing a comprehensive data foundation before building analytical views on top. This approach, described in this video, ensured that finance users could access any financial dimension without requiring additional engineering work each time a new question arose.
How did HSS organize teams to build X-Ray?
HSS used a cross-functional pod model that brought finance users and data engineers together into a single team with shared ownership of the platform. This product-thinking approach aligned technical decisions with business requirements and accelerated the transition from the old Excel-based workflow to real-time financial reporting.
Full transcript
[00:07] Um again, thank you all for coming. I have the pleasure of speaking today about some amazing work that our team at HSS, the Hospital for Special Surgery, had the opportunity to do to transform the way that our organization does finance essentially. What we ended up doing is building something on top of Databricks using Sigma and we named it
[00:23] X-ray. And in the same way that X-ray imaging shows the inner workings of our patients' bodies and shows us what's wrong with them, we're trying to do the same thing with our organization's finances. Uh what we failed to realize is naming something X-ray in a hospital is very confusing, but at
[00:40] least people are talking about us, so that's great. Today I'm going to talk about why we had to go and embark on this. Uh I really believe it's a transformation. What we did on Databricks and Sigma and why. What we ended up building, what this unlocks, and hopefully some time at the end for questions.
[00:55] So, I think in order to understand why we had to do this, I think we have to know why HSS exists and who we are. The Hospital for Special Surgery is number one in orthopedics ranked by US News & World Report consistently uh 16 years in a row now.
[01:11] We are amazing at our clinical practices and the ways that we treat our patients' ailments. It's the same pursuit of excellence that we hope to apply to the way that we handle our data. Um in this particular example, you know, we went off to transform the domain of finance, but we're doing work all across the
[01:26] board. Uh when we started building X-ray, it was October of 2025. Um while we were getting awards for our clinical care, I don't think anyone was giving us awards for the way that we were doing data or the way that we were
[01:42] necessarily using that data to transform finance or operations. Um it was the classic sort of I call it the workflow of doom and despair. It was Outlook, Excel-based, Teams, everything's a meeting. Let me go fire off an email that it an
[01:57] Excel workbook. I make some changes, fire it off to somebody else. So, it was this constant back and forth. Um a lot of human toil went into it. If you're familiar with finance, you have monthly close cycles. Those happen on the magnitude of months sometimes for us, and so we wanted to really bring that down. Today, actually to days, um which
[02:13] is which is amazing. Um and as an aside, on an even more strategic level, we knew that if we got this right, in the same way that we all work in data, and I'm sure you guys have conversations, you know, today it could be with your sales team, tomorrow it's with your operations team, the next day it's with your your HR team. Finance has
[02:31] the opportunity to cross cut the whole organization in the same way. So, you turn finance from a vertical into a horizontal. That leads to some really robust discussions. It's not just why is the EBITDA down? You drill down further and further into the lowest grain of the operational data that you have. So, we knew that if we
[02:47] got this right, we not only would fix all of these limitations on the screen, we would have an opportunity to transform our organization's handling of data through getting our foot in the door with a financial conversation. So, that was why we had to do what we did. I'm would love to show you guys next how we did it.
[03:03] So, we had Databricks already. We had already embarked on a long a long full data ingestion of our EMR, in this case Epic, as well as our ERP, uh which is Workday. We did medallion architecture. We land the data as bronze, move it over to gold. So, our Databricks layer was was
[03:19] pretty good. We were ready to go. Spent a long time making sure that we did the ingestion correctly. All we needed now was the visualization layer, something on top that made it easy for us to give something to our users, in this case finance users, that was familiar. And Sigma was a standout choice. It's Excel-like. The adoption
[03:35] rate of that is very easy. It's not scary. It just looks just like Excel. And if you know finance users, they love Excel. Um and then the very bottom there, Unity Catalog. Um one of the most amazing things about Sigma is just inheriting the permissions, all the attributes that you've already set in Unity Catalog. It
[03:51] just translates over into Sigma. So, our teams really only have one place to have to manage that. I do need a shout-out our product-oriented delivery model. Our team was already working in a pod model, but the interesting thing is we brought our finance business users into the pod.
[04:06] The best way for me to capture this is our CFO said it best, you know, we have finance bros. He calls us the tech bros. At the end of all of this, we're just all bros. Everyone's working together, shared outcomes. Um it's not it's not a
[04:22] joke. Our CFO's using terms like medallion architecture and that really trickles down to his whole team. Uh when I look at that team today, I can't really distinguish who's a data person, who's a finance person. I've got data people saying things like EBITDA. I've got finance people talking about the lakehouse fluently. Uh it's really
[04:37] something that I think is transformative and we're really proud of. Okay, so what did we actually do? What did we build? So, this is X-Ray. Um when we set off to do it, it was essentially just take an Excel spreadsheet, the ones that the finance users already had.
[04:53] Basically just build it. Build the same thing, but underneath, we all know that the beauty is what's underneath. It's live. Every day those pipelines run, that income statement that we start off with is is live. It's a true representation of the source of truth, in our case Workday. We started off with the income
[05:09] statement. We also ended up building the other big uh the other two out of the big three, the cash flow statement and the balance sheet. What we found was starting off with the income statement and then adding details, adding operational data that allows us to go from just a plain income statement to hyper-specific, domain-specific P&L
[05:25] statements. Things that our users want to know more about. So, it's not just numbers, uh financial numbers, it's it's a representation of their day-to-day business next to the financial numbers. Um Uh very quickly in terms of what X-Ray
[05:40] in this version was able to give you, um 18 measures across 33 dimensions. Kind of your classic measures, revenue, cost, profitability. Um we started to bring in volume, surgical volume, visit volume on the hospital side. Dimensions, pretty classic. So, we
[05:56] loaded up our chart of accounts. Um if you're familiar with accounting, the representation of your business through different accounts on your ledger. Um cost centers, procedures, specialties, payers on the insurance side, all of that. So, the underlying data model that we had
[06:11] was only able to be done because we had spent so much time hammering this concept of we're not going to be use case specific. We're not going to build an income statement and go get the data for the income statement. We're actually going to go get everything in Workday. And we don't know what's going to come
[06:27] when we start building this. We're going to ship it to our users, they're going to ask a bunch of what ifs, what abouts. And if every time we have to go back into the source system, figure out what we need to ingest, how to model it into gold, we're never going to get there fast enough. So, uh my recommendation is if you're going to go do something like
[06:43] this, really go look at your ERP, look at your source systems, and bring all of that in full sale at one time. Uh it pays dividends in the end. Um at the end of all of this, you know, we have something we call the FSX ray metrics view V3. Uh it's not actually a native Unity catalog metrics view, we
[06:58] just called it that cuz we we were going fast. Um but it's 6 million rows, it's 5 years of data since we went live on Workday, all represented. From the technical side, uh in terms of how you then interface that with Sigma.
[07:13] Our our users were really looking for basically an Excel-like experience. Um Sigma does a really good job out of the box to get you there. Um some of the limitations we had to had to fight over is really "Hey, in Excel, I can I can drag and drop this column to size it up any way
[07:29] that I want. I can hide these rows, I can make this thing bigger, this thing smaller." In Sigma, it's possible to do all those things, but it's not as easy as any user doing it in Excel. Um some of the ways that we got around that, I'll talk about in a bit. Um but it was really about using dynamic
[07:44] filtering. Um the data model layer within Sigma we leveraged. On the UX side, we used the native modal view within Sigma a lot. Um if you have a big income statement, it's really hard to represent the next drill down of activity into that income statement. Sigma has native drill down, which is
[08:00] great. But if you want to go another level deeper, um on the bottom right, you can see that we added in labor details. That was the first slice of operational data, which for the first time, I believe in our organization's entire history, we were able to give our users your financial data and your operational data right there in
[08:16] the same place. And so you click the button, the modal comes up, you see your labor details filtered already to the to whatever you were looking at specific to your cost center. Um and then we also have a dynamic glossary. For a lot of our operational users, finance is a totally different domain, in the same way that it was for
[08:32] us. Um not all of us knew what EBITDA was when we started, we didn't know what depreciation was when we started. So our operational users, our customers don't know the same. Um in the past, you know, we would have hardcoded all those definitions into the glossary, you know, a cute little tool tip, what is this thing? And then the moment you write
[08:48] that description, it's sort of not fresh anymore. We're actually pulling all of that from the lakehouse dynamically in one place where we're maintaining that definition, and then Sigma's reading that from our lakehouse tables and showing that to the user.
[09:03] I won't read all of these, um but I would say the best the biggest callout in terms of I think what we did right that we'd love to share with everyone is just making sure that you get all of your data out of your source systems correctly. Spend more time modeling all of that correctly, so you spend less time in cycles sort of in the room with your
[09:19] developers figuring out what a definition is, where something is. Um and then for getting Sigma to sort of um behave the way that you want in terms of full flexibility to look like an Excel sheet, um dynamic headers that satisfied our customers' need to have a
[09:34] more um granular UI control. And then uh nested uh nested dynamic headers and blank rows. Okay, so the really exciting stuff in terms of that's great, we basically built the spreadsheet, it's in the hands
[09:49] of our users, you know, what are the things that we're seeing now? Uh when we started it was October of '25, and we launched V1 January of this year. So, we've had about half a year to kind of sit back and watch, and we're still developing. Some of the really interesting things that we've noticed
[10:06] So, we sought out first to just make reporting table stakes. I think it's a big win that if your if your monthly close takes months, and it takes a long time just to get the numbers, we can deliver it to you as fast as that browser loads, right? And the SLA is that it's it's reflective of
[10:22] what's in Workday, what's in Epic. So, if something looks wrong, your teams have to go into those source systems, change it, we run the pipeline again, and now it's fixed. So, I I always said that that's sort of table stakes, right? Like a report is cool, it's nice, but everyone should have that. What
[10:37] we're starting to see now is just some fast wins simply of just exposing the data. Even on our own team, when we started using X-Ray, we realized there were things on our cost center and our budget that we didn't know about. And then so the name X-Ray really we were like we had a moment, we were like, "See? Like X-Ray, ah."
[10:53] Um And the same thing for other cost centers where they have things like software spend on their cost centers on their budget that they really shouldn't have, right? So, it's starting to have those conversations of over the years things that have landed in in different financial buckets, should they really be there?
[11:08] The higher order impact that I'm really excited about, and I alluded to it earlier about how do you get your CFO to start saying things like declarative pipelines, and start talking data the same way that we do, if you start with finance, and you look at, you know, let's say for an example,
[11:25] um in healthcare, you know, we can look at our our revenue, and then you can look at the marginal, um, the next the next surgical case that you add on, are you making the same amount of profit, are you making more profit, are you making less profit?
[11:40] Let's say for for example, your marginal profit is flat. Or worst case, it's it's low. Meaning like for every new case we add, you're actually making less profit. So, why is that? I would say the financial way of looking at data of old sort of ends there. It's sort of a nice tidbit.
[11:56] Okay, we have to go investigate why that's the case. If you do it the way that we did it and you have X-ray set up, the conversations we're having go all the way down to the level of action. So, it's it doesn't just end at that's a nice investigation for us to look into. Let's call a meeting and circle back a week from now.
[12:12] We drill down. We say, "Okay, let's go bring up the surgical cases." X-ray shows you the labor detail. You see it's premium labor is increasing over that time frame. That's interesting, right? Well, why is that happening? And we keep going, we keep going. At the very end of it,
[12:27] what ends up my what you end up my having what you end up my having happen is, well, we can't staff correctly because we just never had the data available to us. Okay, well, why not? Well, we just never brought it into a place where we can actually use it. Well, why not? I well, are you saying that we should go build
[12:43] like a staffing app or we should be go fix that problem? The answer is yes, right? And so, we start off with building something just like let's go get an income statement out the door and now we're solving very very very granular problems that actually impact your financials.
[12:59] Don't just take it from me. Here's a quote. We didn't just modernize reporting, we changed how our org operates. It's from Richard Lee, the senior director of product at HSS. So, what's next? Um, you know, we we really want to see how
[13:14] AI meaningfully integrates into the experience. Today, we're already at context. Um, AI through chat, the way we all know it, to describe the definitions of what what looking at. Um, we're halfway, I would say, into the analysis piece. So, the same way that a
[13:31] human would look at a financial statement and try to figure out what's interesting, we're we're starting to see AI be able to do the same. Um, the most exciting thing at the at the last step of action, um, I alluded to it earlier, let's say for staffing, if we can detect that staffing is starting to go out of the normal bands
[13:47] of what we are okay with, maybe we can trigger an alert to the teams that are responsible for pulling the operational levers to change up staffing and get it in the right bands. Maybe the end game of that is actually we've trimmed down on any of those discussions from happening in the first place. Maybe the end game of that is AI is
[14:04] staffing us. So, I'll I'll end the conversation with you all to ponder about the uh the notion of AI staffing humans. But, I'd like to just make sure that I uh send gratitude to all of the people you see their names on the screen and and the companies that helped us. Um,
[14:20] we use Sigma for the visual layer, Databricks, obviously, for our lake house. Introworks was integral in helping us get an understanding of how to use Sigma. Tridance for getting data out of our ERP Workday and model correctly. Dispatch as well for advising on the ins and outs of Workday,
[14:36] essentially. Thank you all for coming and listening. Really appreciate it.
Learn more about the Databricks Data and AI platform.
The information provided herein is for general informational purposes only and may not reflect the most current product capabilities or configurations.