Unified SRE Observability: AI-Powered Dashboards with Databricks Genie
Summary
- Workday built a unified SRE observability platform on Databricks that centralizes 9 million queries across 99 data connectors from fragmented sources including Snowflake, ServiceNow, and FiveTran into a single pane of glass.
- The platform uses Metric Views as a semantic layer for consistent KPI governance and Databricks Genie for conversational AI, enabling stakeholders to get instant answers about incidents, performance, and SLA trends without writing SQL.
- After implementing AI-powered automated reporting with anomaly detection and a feedback loop to reduce hallucination, Workday achieved a 46 percent reduction in query time across the SRE organization.
Unified SRE Observability: AI-Powered Dashboards with Databricks Genie
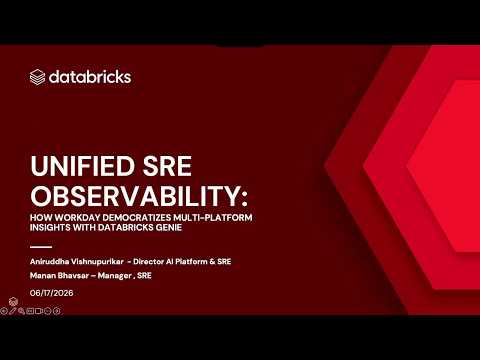
As Workday's infrastructure scaled across cloud platforms, SRE teams struggled with fragmented observability. Metrics lived in Databricks, Snowflake, ServiceNow, and FiveTran, forcing engineers to pivot between tools and perform manual reporting. Workday built a unified observability platform on Databricks, centralizing 9 million queries and 99 data connectors into a single pane of glass.
Learn how to architect unified observability using Delta Lake, Metric Views for semantic KPI governance, and Genie for conversational AI. The team implemented routing instructions, automated reporting with AI anomaly detection, and feedback loops to reduce hallucination. Stakeholders now get instant natural-language answers about incidents, performance, and SLA trends without SQL. This shift from static dashboards to AI-powered exploration has reduced query time by 46%.
🤝
Chapters
00:00Introduction and Workday Overview01:44Business Problem: SRE Metrics Fragmented Across Platforms03:56Solution: Unified Observability with Databricks05:16Architecture and Scale: 9 Million Queries06:22Technical Journey: SRE Platform Challenges08:34Medallion Architecture and Conversational AI10:43Why Databricks: Unity Catalog, Metric Views, Genie13:27Foundation: Delta Tables and Data Layers14:45Metric Views: Semantic Layer for KPI Governance16:39Demo: Dashboard with Filters and Incident Metrics19:40Genie Code: AI-Powered Chart Transformation22:20Genie Space: Routing Instructions for Multi-Metric Context24:29Genie Query Execution: Chat and Agent Modes27:30Genie One: Automated Daily Reports and AI Insights31:13Impact and Results: 46% Query Performance Gain32:20Future Work and Organizational Expansion
FAQs
What problem did Workday's SRE team face before building a unified observability platform?
Workday's SRE teams managed over 30 platforms with metrics scattered across Databricks, Snowflake, ServiceNow, FiveTran, and other tools, forcing engineers to pivot between systems to answer basic questions about SLAs, incidents, and platform health. This fragmentation created significant manual back-and-forth whenever leadership requested operational status.
How does Workday use Databricks Genie for SRE operations?
Workday configured Genie with routing instructions so it can answer natural-language questions spanning multiple metrics and systems, enabling stakeholders to query incidents, SLA trends, and performance without SQL. They also implemented Genie One to automate daily reports with AI anomaly detection, and a feedback loop to reduce hallucination over time.
What are Metric Views and why did Workday use them?
Metric Views provide a semantic layer that governs how KPIs are defined and calculated consistently across the platform, ensuring that everyone querying the data works from the same definitions. This layer sits above Delta tables in the medallion architecture and ensures that metrics surfaced in dashboards and through Genie are consistent and trustworthy.
What performance improvements did Workday see after implementing the unified observability platform?
Workday achieved a 46 percent reduction in query time after centralizing 9 million queries and 99 data connectors into the Databricks-based platform. The shift from static dashboards and manual data pulls to AI-powered conversational exploration also freed the SRE team from interrupt-driven reporting requests.
Full transcript
[00:09] Hello everyone and thank you for joining. So we are here today to walk you through unified SRE observability. So my name is Anirudh. I'm from Workday. I work as a director here
[00:25] for AI platforms and SRE team. He is Manan. He is the manager for SRE team. So uh what is Workday?
[00:40] So Workday is the enterprise based sorry cloud based enterprise platform. And it is handling HR and finance management basically. And
[00:56] it has that agentic component also in it. So you can use built-in agentic AI that will automate your complex workflows. So and it actually handles the complete
[01:12] employee life cycle also, which is human capital management right from onboarding till the termination of the employee and everything in between like your absence management, your payroll, your performance management and everything.
[01:28] Within financial management again, it's procurement, accounting and everything. Then there is adaptive planning component also, which is like the budgeting part of it and forecasting and everything
[01:44] there. So that is about Workday. Then I'm here to talk about the business problem that we solved and Manan will walk you through the the technical uh complexities and implementation that uh we did. Uh so,
[02:00] yeah, next slide. I think that's not working, I think. Yeah. Uh so, Uh I I'm a director. We uh manage around 30 plus platforms here uh related to AI and data. Uh and uh they are all
[02:19] scattered. Uh Uh so, they are not uh obviously like let's say Databricks is one platform. Uh another database is another platform. Then we have ETL tools uh and multiple ETL tools based on the uh uh use case that we have. We have
[02:34] reporting tools. We have uh uh coding and versioning uh tools that we uh we support. So, uh as a uh let's say leader of the team, I want to know how we are doing operationally. Uh so, I ask my team or my leadership uh
[02:52] asks my team that All right, uh let me know uh what is our uh let's say SLA, for example, right? How much time we have been uh up or down, uh for example, in last 1 month or 1 year. Uh we also support
[03:08] incidences and change requests. So, what is our How many incidences are uh coming in uh and how many of them are getting resolved? What is the priority? Uh so, all these things are there. So, whenever I ask a question about uh uh let's say a particular platform, my
[03:24] team used to go uh and pull the data. They give me that data. I again ask something. They again go back. They give me the data again, right? So, there was a lot of back and forth. Uh and uh since we have multiple platforms, data is
[03:39] scattered across the places, uh there was a lot of frustration, right? With respect to delays uh in getting the data and uh reporting it out uh and inaccuracies, uh drawing your own, let's say versions of the metrics and uh so on. So,
[03:56] as you you can see in the diagram there, right? Like the engineers are burdened. They have to go multiple places, get the data, consolidate, give it to me, I report it out somewhere else and so on. So, that was the business problem. The way we solved it was we had a
[04:12] let's say central layer, which is the Unity Catalog layer, and everyone can now go there and get the data that we want. And of course, there is one definition for the metric and all the benefits that we get along with it. So,
[04:28] hope I'm clear on the business problem that we were trying to solve. So, yeah, this is it, right? Like solution is we have our AI-powered unified observability platform. So, data silos are now resolved. We have a
[04:44] central place where all the data resides and reported out. Be it let's say ITSM, be Data Bricks, be it any other platforms or ETL tools, the metrics that we care about are reported out through single platform.
[05:01] And of course, then semantic layer and conversational capabilities that we get out of Genie that we used for it. And then of course, Manan is going to go through a demo. We always run into the technical issues
[05:16] with respect to demos. So, hopefully we are lucky this time. Because in my life, I've always seen that there is something or the other that will go wrong with the demo. So, fingers crossed today. Yeah, and just to give you a scale, these numbers are approximate just to
[05:33] maintain the confidentiality, right? Like we have about 9 million queries that get executed, around 800,000 jobs that we are executing. We have lots of users across Workday it. Uh
[05:49] then my team resolves about 7 to 8,000 incidences per year. Uh we pull data from various sources, about 99 connectors, and uh we manage about 39 uh business services across uh
[06:04] six assignment groups in the uh incident management. So, these are all approximate numbers. So, uh So, that's how uh the scale of the problem uh or metrics that we wanted to uh track uh as well.
[06:22] So, now I think uh Mannan, you can take over and walk us through the uh technical uh journey that we had been through here. Thank you. Hi everyone. My name is Mannan, and I hope you're enjoying your summit so far. And hope you'll enjoy the session as well, wherein you'll take something interesting out of this session, I'm
[06:38] sure. And we are focused more on this session on the Genie part of it, and how we leverage Genie and the IBL dashboard to resolve the problem that Anirudh just mentioned. So, the issue or the question that we normally get from our leadership is that being an SRE team, uh we need to
[06:54] make sure our platforms, uh the database platforms that we have, the ETL platforms that we support, and uh the rest of the things, the incidents, and you name it, that make sure that the data is loaded correctly. All those platforms, we are the one who are responsible to support it. And these
[07:11] platforms are business-critical platforms. So, they need to provide data to the users, and in in in case of delays, there could be a P1 or a P2. So, the kind of answers that leadership looks out from us is that are all the incident met, or do we have What is the
[07:28] mean time to resolve a particular incident or for a particular platform? And the second is what is the trend of P2 incident that has come. So, those are the kind of some critical uh questions that we have to answer. And as Anirudh mentioned, all this information, all
[07:44] this platform, they have their own metadata. They are scattered across different places. We need to go into each and every monitor for that platform. Say for example, SnapLogic. I need to go into the SnapLogic part of it and just need to make sure that what went wrong with the pipeline. Or if there is a database, I
[08:01] need to make sure whether that particular query executed correctly or not. And if it has if it has failed, what is the reason for its failure? Is it the pipeline that failed or is it the query that did not perform well? So, all this information lies at different places. And to consolidate them, we
[08:18] never had a platform or a place where we could put all the details, all the metadata at one place, bring it at the same grain, and then kind of do our analytics on top of it. So, that was the problem that we wanted to solve. And we
[08:34] envisioned a blueprint for that. So, something that we envisioned was that is more of a classic data warehousing problem or a data engineering problem where in we wanted to ingest everything into a common platform and into a common layer and then build a
[08:50] medallion architecture around it. Maybe have a gold or have a raw gold and a certified layer. And then once that particular setup is done, we want to publish that data to the dashboards. If we were back 10 years back, probably
[09:06] dashboard was the only way of resolving uh these kind of issues. But there are some limitations with the dashboard. They have static information. They have metrics which you could have tons of metrics in the dashboard. And probably some users want to see
[09:22] uh MTTR. Some users want to see what is the change control. So, all those metrics putting in a single dashboard was not possible. So, that's where we leverage the AI component uh and we wanted to have a conversational AI on top of it which could use the same data
[09:38] set that we have leveraged leveraged for the dashboard and come up with the answer so that the numbers that are there on the dashboard as well as one which are getting returned from the genie or or the AI part is is is the same. So, while implementing this we wanted to
[09:53] make sure that we have the right governance in place. We have a semantic consistency wherein the KPIs that we have defined, they are uh uniform and agreed upon by all the users. So, if I have a definition of MTTR, it should be
[10:09] agreed upon by all the users uh that for whom the incidents are raised. So, that is what we wanted to have. We did not want to invest into additional tooling. So, all of these things we wanted to consolidate in a single platform so that no additional BI tooling or no
[10:26] additional BI reports are being created. And something that we were looking for is uh AI layer. So, we just wanted to make sure that those uh platform also comes with AI capability. So, that's where uh we approached our solution to be
[10:43] built in Databricks. So, how we use Databricks is uh if I if I go into the previous slide, Unity uh Unity Catalog, it provides the basic governance uh to the entire thing. So, I if you had attended a keynote
[10:58] yesterday, uh something interesting was said. Normally, all the database platform or all the platform, they have a catalog which is like a metadata. Why Unity Catalog or why Unity Catalog is being termed that way? It is because that it not only controls the metadata,
[11:15] but anything that goes into that or anything that goes into Databricks is controlled via Unity Catalog. So, even if I have my AI models, they will be controlled by Unity Catalog. So, it resolves one fundamental issue which I think that this that was discussed yesterday, which is of control. So, you
[11:31] don't have to work on multiple control access. Instead, you just need to have a single control identified in the Unity catalog, and all the users who meet that particular control can access your data. So, that is the Unity catalog part of it.
[11:47] The second part of it is the metric view. Uh I did touch on touch up on the semantic layer of it. So, how many of you have attended the metric view training that was there or provided by the Databricks maybe by a show of hands?
[12:02] Okay. So, no one. So, metric view is one of the uh is is kind of a view within a Databricks, which gives you the semantic context or the business context. So, that was also uh in in yesterday's keynote basically. So, that eliminates
[12:19] the definition of having different KPIs. So, our uh our intention was to have KPIs which are uniform across all the business platforms, and all the users agree on those KPIs. So, the metric view has that capability wherein if we agree
[12:36] on a particular KPI uh and the definition of it or maybe maybe a formula for that, it it remains uniform for all the platforms wherever those MTTR definition has been referred. So, that's what metric view will help us. And then uh the AI BI dashboard, that is
[12:52] what Databricks provide. So, that's what we went with. And then on top of AI BI dashboard, we also have a genie. I think genie was the talk of the town yesterday. Uh so, that's what we implemented uh 6 to 7 months back. And that gives us uh flexibility or the
[13:10] capability to have governance consistency, visualization, and the AI part of it in a single platform. So, that was our reason of why we went to Databricks. So, uh I'll just run through some of the foundation things that we built uh in
[13:27] order to uh set up the stage for the demo. So, we built So, this was like building data data layers or the database within the Databricks. So, we built a Delta tables. So, what we did is we ingested data from
[13:44] various sources. We got we we loaded that in the raw table. We loaded that in the base table. And these tables were Databricks managed Delta tables. The benefit that I I'll just give you some quick
[13:59] performance-related things that we experienced. The benefit it gives is that it gives a feature called as predictive optimization. So, that way your query can perform faster if you are using Databricks managed Delta tables. The second thing is
[14:14] it you don't require any additional maintenance for it. It adapts to whatever platform that gets upgraded to. So, that's the reason why we implemented this particular solution and having a base layer and the raw layer in in the Delta tables.
[14:30] The next part is the Symantec foundation or the metric view. Apart from metric view giving us a uniform definition of the KPIs, one of the main benefit or one of the winning feature of
[14:45] the metric view is that you can use metric view with Genie and with dashboard both. And Genie performs better with metric view because of few things which which I'll just go through the next slide. But, metric view and Genie are are one of the best
[15:01] combination that you can use to get your AI answer the data correctly without any hallucination or maybe minimum hallucination. Okay. So, this is what metric view basically looks like. I mean, yesterday I was in that Symantec session just to fill up some gaps on my understanding on
[15:17] the metric view. So, these are some of the like this is the format how metric view looks like. It has a version, it has a source A source can be a query or a fact table or any table which you want to use within your metric view. Then you have
[15:33] joins that you can use within the metric view. And then there are dimensions. So that ways you don't have to uh you can define the dimension itself within the metric view. And then the measures. So measures are the uh facts that you basically want to uh
[15:48] calculate as part of your KPI. So it can be count, sum, any sort of aggregation. Okay? And these are some of the features that metric view gives us version, source, join, filters, measures and dimensions. So all these things you can use and it's basically a YAML file. So
[16:06] the benefit of that is that this becomes a version controlled YAML file wherein if say for example I define a metric only I can change or I can approve a change to this metric when it's version controlled. So no no one else can
[16:23] uh update this metric and push the file into the gate. So that you can version control it using Git and all. So that's the benefit of using a metric view. So I think now yeah, so these were step one and step two. I'll quickly jump onto
[16:39] the demo and I'll show you few things that uh we developed. Uh this is again uh we have specifically created for the summit. Uh it does not have the real in it, but we'll just try to show what we created as part of the
[16:54] dashboard. Yeah, the real dashboard has uh very similar uh metrics. So yeah, one more thing that we did using this is we replicated our real dashboard for this summit entirely using the Genie code. So that's that's the scale at which Genie code can operate
[17:11] and replicate the entire data. Okay. So I'll quickly uh run you through various filters that we have and so these these are the tabs that we created. So if I want to understand what is the total
[17:27] incidents that are there and what's what are the number of active incidents that have been created. These These are the priority filters so I can filter my incident based on P1, P2, P3, P4s. These are the states where I can use like whether they are closed, in progress, so on and so forth. And what we have done
[17:44] is we can also select whether we want to report in change request as part of this. So if I just switch this Yeah, it's refreshing. It just gives us the details of the change request. So that that's how we developed this for
[18:02] the incident. Then similarly we had for cloud performance or the cloud adoption. Now with various AI features or every vendor providing AI layer to it, we just wanted to assess whether how are we adopting to those
[18:18] features, whether we are using it optimally or do we have number of users who are using it. So these kind of metrics helps us to understand what was the active user for the current quarter and what was the active user for the for the previous quarter. So if you see the green indicates that yes, we had 210
[18:35] active users. So that is like one user additional than the previous quarter. We had no new users and the users deleted was zero. So these were the These are the kind of metrics or the reports that we can build
[18:51] from from the KPI platform that we created. So this just highlights what are the number of inactive users, these are their email IDs and we can just show we can just email them if they're not using this, we can just deboard them from the platform. So that is the detail that we
[19:07] are have capturing in the cloud adoption. In the database performance again, yeah, this is a synthetic data, so we we haven't able to pull that out. And I think this is for the cloud job performance. So, whenever a pipeline that executes in cloud, we just
[19:25] Sorry. We just want to make sure that they're running and what is the number of DBUs that it is utilizing. We are just taking Databricks as the example. So, it it just helps us understand how many DBUs they utilized for a given given pipeline that executes. So, these
[19:40] these are the kind of things that we can do. Now, let me introduce to something interesting over here. Now, say for example, I am over here in this particular chart. Anirudh comes and tell me, "Hey, Manan, I don't want to see this as a bar chart. I want to see this as a heat map." So, I can just
[19:57] go edit draft. And I can just invoke a genie icon over here. And I can just say,
[20:13] convert this to heat map. So, what it does is it will just give us this entire thing. And genie code will trigger and it will start making changes to this particular to this particular graph into heat map. It will ask us It will It will
[20:29] check the dimensions. It will check the facts that are used in the bar chart. It will interpret them so that it plots the correct heat map. And it will ask us whether we want to proceed with it or not. So, we'll just wait for it for some time. So, this is the first demo. The second
[20:45] demo is more on the genie side that I'll be covering. And the third demo is on the genie one side that that we had discussed in the keynote meeting yesterday. So, it's just asking me whether I want to edit the widget. So, yes.
[21:00] So, yeah, this got changed to the heat map. And I think it's just making some final changes. Once this particular red button goes away, the changes are done. And still these changes are not published. It's still in edit. So, if
[21:16] this viewing this report, he'll still see the bar chart. But I if I hit publish, it gets published to all the users who are using this report. And then it's it will it will be more of a heat map for everyone. I'll I'll just revert this and I'll just say
[21:32] revert to previous format. So, these are the kind of enablement that Genie gives us when we are plotting or when we are using dashboards
[21:48] within within our organization. Earlier these changes used to take like maybe a week's time. Now it's just within within 5 minutes you can you can plot all these changes. So, yeah. This has been done. It's again back to the original. I think the labels are not available. So,
[22:04] probably I can just go over here. Turn on the labels. And yeah, this is done. So, this is back to normal. I'll just hit publish. And this this is now visible to everyone. Okay. So, this is one demo that we
[22:20] wanted to highlight. The second one is Okay. So, this is our Genie. Every Genie has every Genie that we create that comes with option of what what context that you want to run that
[22:36] Genie with. Okay. So, for us what we have done is we have used these metric views. So, ideally whatever examples or demo you see, you must have seen one metric view per Genie. But what we have tried to do is we have scaled up using six metric
[22:53] views. And as we expand our capabilities for the KPI dashboard, we will be embedding more and more metric views into into into the genie. So, this is how the genie looks like. You have to provide the data to it wherein you can provide a metric view, a
[23:09] table, or any anything of a file to it. And this is what we have done. We have just provided unified metric view so that the KPI definition remains same across anyone who is using it. And one more thing that we have to mention for the
[23:26] genie is the instructions. So, what we have done is we have used the routing instruction wherein if some user ask what are the incidents, what are the change request, what are the tickets, what is what is the MTTR or of anything of that sort,
[23:42] that metric view is referred. Then this particular metric view has to be referred. If anyone ask about what is the query performance, then probably a different metric view has to be referred. A database performance metric view has to be referred. So, this way we have created tons of instructions, not tons,
[23:57] but it has a limitation of 2,000 characters. So, what we have done is we have just restricted it to 2,000 characters. And most of the comments or most of the understanding about the columns, we have used it in the metric view. So,
[24:14] this is how it looks like. And one good thing that we have I mean we have just tried to say that after answering give us one or two follow-ups. Like if the user wants to follow up on couple of things, you can you can suggest what what he can follow up on. So, let me
[24:29] just run this metric view for you guys. Okay. So, it comes basically with two modes, the agent mode and the chat mode. Agent mode is pretty straightforward. Sorry, the chat mode is pretty straightforward. It's it's meant for non-complex queries or simple answer.
[24:44] The agent mode would go into thinking mode and all. So, that's that's what it goes into. So, I'll just pick up some old questions so that So, I'll just pick this prompt up. and uh let me just ask it.
[25:17] Okay, so here it is, and I just hit enter. So, what I've said is what is the daily incident rate for the current quarter? Calculate the total incident divided by number of days elapsed for the current quarter. I'll just say blur out the details
[25:36] for services or assignment groups. So, let's see what it answers. So, when when we ask this question based on the instructions that we had written in the in in the instruction part of the Genie, it will understand which metric view it has to query. It it gets that context.
[25:52] It goes into that particular metric view. In that metric view, like as I'd shown on the dashboard, it had two two parts. One is incident, one is change request. So, here we are asking specifically for the incident part. So, it just goes to that particular incident, and it just gives us this particular detail uh as part of the
[26:09] metric view. So, this is how Genie is enabled or powered by the metric view, and based on the clarity that you provide in the metric view comments and the instruction, it will cause less hallucination for the Genie. So, these are some of the practice that we have learned hard way or by working with the
[26:26] Databricks team. Uh but yes, uh for now, what we have experienced is that uh it's it's performing almost 99% well. There is one more feature that probably you can use if you're rolling out it to a wider audience. Uh this is whether the response is
[26:41] helpful or not. So, what it basically does is that whatever question that I had asked, whether that response was accurate or not. If I say yeah, uh
[26:56] Okay, my history. chat. Yeah, if I say that yes, the response was good. I I gave the positive feedback and then what it will do is it will just mark the rating over here as good. So, whenever any other user ask similar kind of question, it just checks that okay, the
[27:12] last question that was asked or whenever similar question was asked, uh I was able to give the right answer. It will use the query that it has used uh for to answer this particular response. Okay? So,
[27:30] that is regarding uh the Genie space. Uh maybe I'll I'll set up uh any Q&As maybe later on. And now, probably this is all good like but we as an SRE team, we want to make sure that we have weekly status report or a monthly status report generated. Wherein I don't have
[27:46] to go and query Genie about it like hey, what is the status at the end of the week? What is the status at the end of the month? Uh I I would just like to send that report to Anirudh or maybe my VP or my director, senior directors and all. So, what I can do instead is that I
[28:02] can go into the Genie one space and I can set up a prompt similar to this. Uh this this takes some time to execute so I'm just giving you uh whatever we executed earlier before the demo. So, I'll just send that share
[28:17] that send an email to Manan Bhowsar for every day morning 9:00 a.m. for the incident report using this particular Genie space. So, I have used this Genie space which was answering me for most of the KPIs. So, I just said that use this particular Genie space, make sure the
[28:34] services names etc. is blurred. Uh it's it's for the confidentiality purpose. Although we are using uh synthetic data, I just want to make sure that I don't uh disclose any services or or the names. And since Manan is a member of SRE team, include details that will help him to
[28:49] deep dive into issues and identify bottleneck. So, here we are just making sure that since Manan is a technical guy who would deep dive into the issues that are generated, generate as detailed report as possible.
[29:05] So, what And then I have asked it to set it up at 9:00 in the morning. So, what it does is that it sets up the schedule at 9:00 in the morning. So, this is what it has set up for us. Okay. And now, if I
[29:20] it has run two times today. Yeah. So, if I just open this, it has generated this report. It has generated all the details that it needed, and it has also provided some AI-based insights or AI functions
[29:36] that it has used to kind of predict if similar incident can happen in future or not. And if it happens, then what is the occurrence for that. So, it has used AI insights. It has used some critical findings to let me know like what is not in place, what
[29:53] is what is going good. And then based on that, okay. It has just sent me this email. So, this is my daily status report that I get every morning at 9:00. And from this, I can just work
[30:09] on the details where I see the red red flag. So, here it says that for team 11, there were there were active seven backlogs, and their average average resolution time is pretty pretty high. So, I can work with team this particular team seven and try to understand what is
[30:25] the reason why it's causing the average resolution time to be high. So, this is the kind of insight that we can get or you know, it it enables us to get insight before we want to spend our entire day uh,
[30:40] getting into it uh, So, this is how the report looks like and yeah, those those were the demos that I had. Uh, I think I made it pretty quick. Yes. And uh, I think I'll switch over to Anirudh now for rest of the
[30:57] presentation. Thank you all. Yeah, I think uh, Sorry, you clapped but there is some part remaining. Yeah. But that was for the demo, I guess. Thank you, it was impressive. Uh, yeah, I think one of the critical
[31:13] things here is uh, Yeah, you're you're on the screen. Okay. It's not going. Yeah, we ran into some technical issue. Yeah, now it's fine. Uh, yeah, so how it helped us is what I wanted to talk about, the impact of whatever work we have done, right? Uh,
[31:31] so because of the metrics that we have exposed, we have been able to uh, achieve uh, tremendous performance improvement like 46% speed uh, of the queries. Uh, then execution time for overall pipelines has have dropped. Uh, cost has
[31:47] reduced because we are we have been much more optimized now. Uh, and uh, so Aniket, you can go through that but uh, this is really impactful. And then these are some actual numbers that we we were able to get from our uh, uh, execution.
[32:04] And what I think is uh, pending work that needs to be done is uh, uh, we want to onboard more users to our platform and increase the adoption uh, so that we will do. Uh, then uh, alerts on mobile using Slack integration or
[32:20] Genie app itself on mobile. So, depending on our security approval, so that is a powerful feature uh, as well. Uh, and uh, of course one of the few capabilities that we were introduced to yesterday in keynote uh, lake base and uh, we also want to have agent TK I
[32:36] enabled uh, as well. So, uh some of the things that we plan to do uh here uh and one of the success also, which is not called out here, is we started this for our own uh our platforms, which are 30 plus for my organization, but uh there is an
[32:52] interest uh seeing the product uh and Genie capabilities uh outside of uh my organization within Workday, uh we have been reached out to build something for them. Our architecture is so flexible that we can onboard uh any uh let's say
[33:08] platform onto our uh uh product, and Unity Catalog helps with security uh and Genie, of course, will help power the uh uh NLP. Uh so, uh very high uh like highly powerful uh
[33:23] tool, and we are getting visibility outside of our organization also with this. So, uh I think something to try out. So, I think now we are good uh and that's it. Thank you.
Learn more about the Databricks Data and AI platform.
The information provided herein is for general informational purposes only and may not reflect the most current product capabilities or configurations.