Real-Time Agricultural Risk Portfolio Management
Summary
- This video demonstrates how the Databricks Data and AI platform unifies commodity prices, FX rates, weather patterns, interest rates, and input costs into a single portfolio view so commercial lenders can identify agricultural borrowers at risk of default before losses are realized.
- Using a Brazil case study where El Niño flooding, crop over-supply, and a 15% Central Bank interest rate triggered cascading defaults, the demo shows how early-warning indicators and conversational analysis enable relationship managers to pinpoint the most stressed borrowers in real time.
- The platform surfaces customer-level metrics — including probability of default, loss given default, expected credit loss, and debt-service coverage — and generates AI-powered coaching guidance with next-best actions such as payment holidays and term extensions.
Real-Time Agricultural Risk Portfolio Management
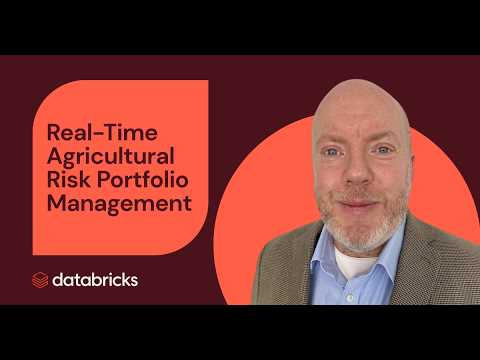
Commercial lending portfolios are shaped by a mix of market, weather, currency, and input-cost signals that can shift risk quickly. This demo, presented by Alasdair Anderson, Financial Services Lead Solutions Architect at Databricks, shows how you can bring those signals into one platform, model their impact on a portfolio, and identify the customers most exposed to emerging stress.
You’ll see a synthetic but real-world scenario based on agricultural risk. The demo walks through a historical view of early warning indicators, then moves into a real-time portfolio view, conversational analysis, and next-best actions that help a relationship manager respond to customer risk with more context.
You’ll learn how to:
➜ Bring together commodity prices, FX rates, weather patterns, interest rates, and input costs into a single portfolio view
➜ Use early-warning indicators to spot stress before defaults are realized
➜ Ask scenario-based questions to assess portfolio impact and identify the most exposed customers
➜ Surface customer-level risk signals such as probability of default, loss given default, expected credit loss, and debt-service coverage
➜ Generate coaching guidance and next-best actions for relationship managers, including mitigation options such as term extensions and payment holidays
Learn more by watching our virtual Financial Services Forum: https://events.databricks.com/FY27Q2-WB-VirtFinsForum
Chapters
00:00Introduction00:43Agricultural credit risk: growing complexity of market signals01:50Case study: Brazil 2023 — El Nino, over-supply, 15% interest rate03:072026 early warning signs: fertilizer spike and compounding risk05:28How Databricks unifies real-time and batch risk signals06:32Demo: early warning indicator dashboard and risk simulation09:29Real-time portfolio view with commodity, FX, and weather data10:47Conversational analysis: asking about the most stressed borrowers11:52Drilling into individual customer risk profiles and IFRS 9 stage13:08AI-generated relationship manager coaching guidelines14:36Modeling next best actions: payment holidays and term extensions
FAQs
Why is agricultural credit risk so complex to manage?
Agricultural credit risk involves interconnected factors including commodity price swings, adverse weather events, currency fluctuations, rising input costs, and interest rate movements that can each amplify the others. As shown in this video using a Brazil case study, a single event like El Niño can trigger a chain reaction — crop over-supply, FX pressure, and a 15% Central Bank interest rate — that rapidly impairs entire commercial lending portfolios.
How does Databricks help banks monitor commercial lending risk in real time?
The Databricks Data and AI platform ingests commodity prices, FX rates, weather patterns, interest rates, and input costs into a unified portfolio view, combining batch and real-time signals to give relationship managers an up-to-date picture of borrower stress. Early-warning indicators flag deteriorating accounts before defaults are realized, enabling proactive outreach rather than reactive loss management.
What customer-level risk metrics does the demo surface?
The demo surfaces probability of default, loss given default, expected credit loss, and debt-service coverage ratio for individual borrowers, along with their IFRS 9 staging classification. These metrics allow relationship managers to quickly understand the severity of exposure for each customer within the portfolio.
What next-best actions does the AI generate for relationship managers?
The platform generates AI-powered coaching guidelines and recommends specific next-best actions tailored to each borrower's risk profile, such as offering a payment holiday or extending loan terms. These recommendations give relationship managers structured options to mitigate risk while also supporting their customers through periods of financial stress.
Full transcript
[00:05] Hello, my name is Auster Anderson. I am one of the field engineering team working in financial services and I lead the banking segment for our European business. What I'm going to talk to you to about today is the ability of the Databricks platform to take in multiple sources of
[00:19] risk signal, uh analyze those signals, build out a portfolio view, and then make that actionable within your business. So, how can you take the current environment, the uncertainty
[00:31] that we deal with on a daily basis, and turn that into a commercial opportunity? So, really, when we look at the world that we live in today, the complexity of
[00:43] risk within the a commercial portfolio, a commercial lending portfolio, is becoming ever more diverse. There is many um potential factors that could impact the
[00:56] the risk of default, the probability of default, and also the impact of that default as well. And really, what you're looking to do within your business lines is to build a capability where you can take those signals as they happen, model based on
[01:10] your uh best knowledge of previous events and potential impacts, and then determine a set of next best actions that will allow you to both protect your business, but also
[01:22] uh um the the business of your customers themselves. So, what we're going to do is take a an example from 2024. Now, 2024 was um a year where an El Niño weather pattern
[01:36] occurred. Um that is something that is not unknown, not uncommon, but it does not happen every single year. And it actually came off the back of a bumper crop harvest in 2023. So, what we're
[01:50] going to look at is something that happened uh and within the Brazilian region, uh where after 2023's um successful harvest and crop, the crop prices actually had decreased because of
[02:03] over supply in the market. Um the El Nino pattern then caused a set of localized flooding within um parts of the the Brazilian uh
[02:15] farming um industry. Um and that then started to impact the fundamentals of the economy. So, the um the effects rates went down Brazilian real US dollar. And as a
[02:27] result, the Central Bank was forced to raise interest rates to 15%. Of course, within a credit environment, 15% interest rate is certainly for um Western Europe and the US almost unheard
[02:40] of these days. More um more frequently happens in the um uh the the global south, but nonetheless, that was still enough of a shock um to cause massive defaults and
[02:54] that impacted portfolios um held by multiple organizations. It wasn't just localized to that region. So, if we fast forward to um 2026, um meteorologists are telling us that
[03:07] another El Nino is coming. It's already started. Um but we know that is compounding on to a set of um geopolitical events um and as well as uh economic events that can fundamentally
[03:21] shift the the the environment in which um uh agricultural companies are working. The streets of farmers, the disruption to the the global supply chain of oil have already been in place for a number
[03:33] of months now. We are seeing that the uh the cost of fertilizer prices has spiked. And when you are a farmer, um you know, fertilizer is a fundamental
[03:46] input component to your outputs. Uh and we're already in a position where some crops might not be worth planting this year. So, what you're seeing is that in the industry, we've got the
[03:59] warning signs of a an approaching storm. However, um uh commodity prices have not yet responded to this factor. So, again, a little bit like 24, you have multiple components
[04:11] coming together for a potential perfect storm. Now, what we at Databricks do is is we understand that these complex signals um can come in from different sources
[04:24] and our data platform is completely built from the ground up in order to take in as complex and and varied a set of data as possible. And that allows you to get to what I've shown here in the maturity curve is the the first stage,
[04:38] really, insight. Being able to bring in all that information um completely um integrate it together in order to give you a unified view of your data, of your business, of your customer's business in
[04:51] real time with all the long-tail factors. That will then take you to the second stage of sort of AI maturity, which is how do you then action um those insights that are being presented
[05:04] to you on the screen through your APIs and your applications. And how when you make those actions, can you guarantee that the best outcomes will be arrived at? And really, this is the sort
[05:16] of um the process of thinking that is is leading a lot of our customers to think about how can I completely automate certain parts of my business in order to ensure
[05:28] that the insights result in the best actions possible and result on the optimal outcomes. So, in Databricks, um we very much believe in um
[05:40] uh walking the talk. And so, what I'm going to do is going to take you into a demonstration. Now, just to set the context, um this is based on a real-world scenario that um
[05:53] has happened and is happening. Um however, it is obviously uh and it's worth stating uh synthetic data. This is not real customer data, but everything you're seeing is actually a Databricks
[06:05] application completely hosted and served by the Databricks platform itself. So, what we're seeing is we have um built a an aggregate an agricultural uh risk portfolio system as um based on the
[06:20] data sets that we've discussed previously and bringing that into um uh data and AI an application environment where we can start to interpret those insights, pull them together, and then
[06:32] look at next best actions. So, if we go to the first screen here, we have a view of really the problem statement that I've already outlined, which is you have a number of signals
[06:44] um within your portfolio. It could be commodity prices, it could be interest rates, effects rates, weather patterns themselves, input costs. How do those all come together? How can you bring
[06:56] them all together in order to make sure that you are fully aware of the risk to your portfolio, the risk to an individual client, and how can you then action what is the the appropriate
[07:09] mitigation to address that risk? So, if we take a a view of a a historical view of what happened in 2024, what we've constructed here is a
[07:21] simulator of all those core inputs coming in, and what the actual risk scores, potential losses would be, and then we've developed what we call the early warning indicator. So, we want to be able to detect potential stresses
[07:36] before they become realized losses. So, if If just um hit the play button here, and what you'll see is we bring in all these um leading indicators. So, you can see the the signal uh starting to build
[07:49] up in the risk pattern starting to display on the panel here. If I just stop it in the middle here, you're seeing that we have signals coming from um commodity pricing, from weather
[08:01] patterns, debt servicing ratios. The FX price is starting to go um against um the the the economy as well, as well as the input cost index. What you're seeing
[08:13] here is that the model as um as is calculated within the data sets and within the data platform, is saying that there's a potential elevated risk of default. But, the actual defaults
[08:26] themselves have not started to occur. So, here you have a lead time before these um before these two indicators cross over. As soon as a default has occurred, obviously, it's too late. What you want
[08:38] to do is get ahead of this. So, if we roll this forward, you can see that without mitigating actions, eventually the defaults will catch up with the prediction. And in this case, they actually um pass by them. So, you have a
[08:50] an elevated level of default against even what the model had predicted. So, what you had here is a 3 to 6 months of lead time to actually do something about the risk within your
[09:02] portfolio based on the signals that you were receiving, but you weren't able to get ahead of that in time. So, if we forward fast to uh current day, 2026, what can we do to take all that signal
[09:16] information and um and put it together in a single platform that will allow you to do that. So, what you're seeing is a sort of uh classic implementation of the Databricks platform. We have commodity
[09:29] prices coming in here from Cboe. We've got the FX rates, the fertilizer rate that I discussed earlier. So, additional indicators that weren't used in the historic model in order to start to pull out a real-time continuous portfolio
[09:44] view that will work out probability of default, the loss given default, and the expected credit loss within the portfolio, the debt service coverage, the ability of a customer to pay, so
[09:56] that you can always have a real-time view of what's happening within your portfolio at the individual customer level, but aggregated up to that customer. always available on the Databricks platform regardless of
[10:08] whether the information is coming in in real time or it's based on more sporadic batch-driven data sets. Full integration, full portfolio view available for
[10:20] you to query all the time. So, when I say query, what I mean is you want to be able to interact with that data on the platform and give it dynamic question sets. This isn't about always asking the same question every day. It's
[10:33] about asking questions that relate to the scenario that you find yourself in. So, if we just run this demo conversation here, which we've loaded up for efficiency purposes, what we're going to ask here is what happens um Straits of
[10:47] Hormuz have been closed, and you're looking at fertilizer costs are 60% above baseline. What is the impact? So, Genie is going to the the database and the model to work out what the potential impact is. We're then asking uh a little
[11:00] bit too quickly, if you layer in uh a foreign exchange movement, so Brazilian real depreciation of 15% on top, you can then look at the um the potential impact there, and then you can
[11:13] ask what customers are most exposed to this fertilizer spike. So, what we see here is we're we're pulling at a single customer uh Fazenda Rio here um because of their exposure to fertilizer prices.
[11:26] So, that fully integrated view is queryable. You can talk with your data, but you're really talking to the data about your customers in order to determine what is the most pressing issue in your portfolio.
[11:39] And what that allows you to do is then identify from the global level really specific stress points. So, risk scores which are an elevated level. So, here we have the same customer has been brought
[11:52] out as the the number one um the number one credit risk score in the portfolio. If we bring that customer up, you're seeing that we're calculating a debt service ratio that's actually below the
[12:04] government in the government agreement that services that debt. Um there's a potential loss here or um a margin compression on the cash return on invested uh income, and also elevated uh
[12:18] probability of default. So, 26% chance of default. And what we're seeing here is that the the actual accounting uh system is putting the the loan into a
[12:30] preference stage nine. So, we're seeing this is a credit credit impaired um investment already. You get a summary uh through the AI agent, and I'll tell you what's going on with the portfolio.
[12:42] But that is the insight. That is the first stage in this process. You know that you have a problem because your customer has a problem. So,
[12:55] You don't want to talk to the customer about your problems. You want to talk to the customer about their challenges and what can you do? So, what we've done here is we've kicked off um an assistant agent, and that agent is gathering up
[13:08] all that information in order to provide a relationship manager who will have that conversation with the background information on what is happening with the customer, and then format that into
[13:20] coaching guidelines. When you're having a customer conversation, what should you open with? What should you discuss? It's a really a a very detailed view of all the information that the customer
[13:33] should be considering. And then do's and don'ts. Don't talk about your problems. Don't talk about the debt servicing credit ratio reducing. Don't talk about the potential for a
[13:46] threat to your investment. Talk about what you can do with that information and how you can pivot that to a positive discussion about your customer's business and what you can do
[13:59] to help. But what we can do is we can take the information from the customer and look at modeling potential mitigation scenarios based on next best action. What can we do with that that servicing of the debt? How can we
[14:12] transform that? How can we refactor the covenants in order to be able to mitigate the risk that the customer's seeing? So what the agent's doing here is looking at the background of the customer's portfolio and their
[14:24] activities and then looking to suggest next best actions. What can be done within this this individual customer, this individual loan agreement in order
[14:36] to mitigate that risk. So here you see term extensions, payment holidays. What I'm going to select here is a payment holiday. Okay? So we submit the payment holiday for approval. That's a standard way of
[14:49] re-refactoring a loan agreement. You can see that the agents have built a new covenant here. So the the actual loan has been the loan refactor has been described. You see the schedule here. So we've got a number of deferred payments. Then with
[15:02] the loan payments in 27, so that money that's that's not being requested or that payment's not being requested can be added on to the debt in 27 and the in the anticipation of a recovery in the
[15:15] business. And what you'll see is a risk summary. What has changed within the actual uh risk portfolio itself? How is the the service recovery ratio change probability of default reduction and
[15:27] then the IFRS 9 stage in the finance side, how is that changed as as well? So, we can send that through and then what we're going to do here is do a prediction of what will be the 90-day outcome. So, we can see that all those
[15:39] things that that that we are looking to protect both on our portfolio side and then the customer side have been achieved. So, you're protecting you uh you're making a counter-cyclical
[15:51] investment in 2026 in order to grow your business in 2027. So, what have you seen here today?
[16:03] Um so, really what we're looking to do is bring that sort of uh hyper-personalization that is often the the sort of exclusive remit of things like private banking or the investment management business. That
[16:16] hyper-personalization of a customer's business and portfolio and be able to deploy that at scale without having to massively expand your workforce. So, really deploying agents to um drive
[16:29] hyper-personalization as well as advanced risk management and mitigation. So, really leveraging the information advantage that you have about your customer, the market, external factors such as as climate and
[16:43] um and commodity pricing and then put that into a scenario testing where they can allow you to personalize the the offering to the customer um and really increase your profitability over the
[16:56] long term. We think that actually this will form the basis of potential new products in the market, the ability to sell um leverage services or or higher-level services on the basis of this
[17:08] information advantage and the artificial intelligence advantage that you can build on the Databricks platform within financial services. And with that, I thank you for your time. And um
[17:20] please reach out to me if you have any questions and want to follow up.
Learn more about the Databricks Data and AI platform.
The information provided herein is for general informational purposes only and may not reflect the most current product capabilities or configurations.