A practical approach to end-to-end Solvency II reporting in Databricks
Summary
- This video demonstrates a complete end-to-end Solvency II regulatory reporting implementation on Databricks, consolidating ingestion, automated quality checks, QRT reconciliation, reserving model approvals, audit trails, and ORSA narrative generation on a single platform—replacing the disconnected multi-system approach common in most insurers.
- A control tower surfaces the current Solvency ratio trend, readiness status, late data feeds, data quality issues, and approval blockers in one view, and an AI agent reviews reconciliations to detect cross-report mismatches and provide a second set of eyes on results.
- Scenario analysis—such as projecting the solvency impact of doubling a cyber book over 12 months—and a Contrarian Capital Reviewer agent generate alternative perspectives to support CFO decision-making, with all actions logged in the audit trail and AI governance log.
A practical approach to end-to-end Solvency II reporting in Databricks
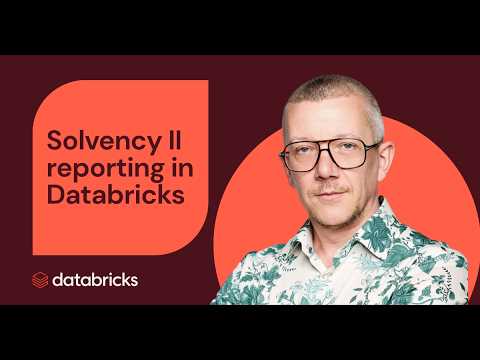
This demo, presented by Laurence Ryszka, Databricks Insurance Sr. Solutions Architect, shows how a Solvency II reporting process can be implemented end-to-end in Databricks. Solvency II is the EU’s risk-based framework for insurer capital, governance, and reporting, designed to ensure they can meet policyholder obligations.
The demo demonstrates how a regulatory workflow can be consolidated on a single platform, with visibility across the entire process. You’ll see a control tower that surfaces the current Solvency ratio, readiness status, late feeds, quality issues, and approval blockers in one place. The demo also shows automated ingestion checks, reconciliation support, reserving model approvals, audit trails, own risk and solvency assessment (ORSA) generation, and scenario analysis for questions like what happens if the cyber book doubles over the next 12 months.
What you’ll learn from watching:
➜ How to bring Solvency II reporting into a single Databricks workflow from ingestion to disclosure
➜ How a control tower can surface Solvency ratio changes, deadlines, approvals, and blockers in one view
➜ How automated ingestion checks can flag freshness, completeness, ownership, and data quality issues
➜ How agents can help review reconciliations, identify mismatches, and provide a second set of eyes on results
➜ How governance, audit trails, and AI governance can track what happened across the reporting process
➜ How ORSA and scenario analysis can be generated and run in Databricks to support faster decisions
Learn more by watching our virtual Insurance Forum: https://events.databricks.com/FY27Q2-WB-VirtInsForum
Chapters
00:00Introduction: Databricks as a platform for business process01:48Why Solvency II is stuck in disconnected systems02:13Solvency II: three pillars — capital, governance, disclosure04:34Demo start: end-to-end Solvency II implementation in Databricks06:55Control tower: solvency ratio trend and readiness dashboard08:04Ingestion monitoring: freshness alerts and late-data detection09:09Data quality rules: row-level completeness checks on claims data10:13QRT reconciliation: AI agent detecting cross-report mismatches12:07Reserving models: pending approval and promotion in Unity Catalog13:14Governance panel: audit trail, approvals, and AI governance log15:35Multi-agent supervisor: asking what is outstanding for Q4 close16:40ORSA narrative: generating the annual report nightly with LLMs18:34Scenario analysis: projecting solvency impact of doubling cyber book19:26Contrarian Capital Reviewer agent: alternative perspectives for the CFO
FAQs
What is Solvency II and why is it difficult to implement in disconnected systems?
Solvency II is the EU's risk-based regulatory framework for insurer capital adequacy, governance, and disclosure, requiring insurers to demonstrate they can meet policyholder obligations. Most existing implementations are stitched together across many different systems, teams, and data sources that have accumulated over the roughly 15 years since the framework was introduced. This video shows how consolidating the entire workflow on Databricks eliminates that fragmentation and provides end-to-end visibility across the full reporting process.
What does the Solvency II control tower in Databricks show?
The control tower surfaces the current Solvency ratio trend, readiness status, late data feeds, data quality issues, and approval blockers in a single unified view. It allows finance and risk teams to monitor the entire reporting process without switching between systems. Automated ingestion checks flag freshness, completeness, ownership, and data quality issues as data arrives, and the multi-agent supervisor can answer natural-language questions about what is outstanding for the quarterly close.
How does AI assist with Solvency II reconciliation and QRT checks?
An AI agent reviews reconciliations across Quantitative Reporting Templates, identifying cross-report mismatches and providing a second set of eyes on results before submission. The multi-agent supervisor answers questions about outstanding items for the quarterly close. A Contrarian Capital Reviewer agent also generates alternative perspectives to help the CFO pressure-test assumptions, adding challenge to the review process beyond what a traditional workflow tool provides.
How is ORSA narrative generation handled in Databricks?
The Own Risk and Solvency Assessment narrative is generated nightly using large language models running within Databricks, automating production of the annual report text. Scenario analysis—such as projecting the solvency impact of doubling the cyber book over 12 months—can also be run directly on the platform without exporting data to external tools. All narrative generation and scenario runs are logged in the audit trail and AI governance log for regulatory traceability.
Full transcript
[00:05] Hello. My name is Lorenzo Reschka. I'm a solution architect based in the UK. I work with insurance clients and I'm also insurance SME here at Databricks. So, today we are talking about Solvency II, so one of the regulatory frameworks
[00:17] and specifically my interpretation of it, how could it look like at the speed of the lakehouse. So, if you were to implement it all in an end-to-end into Databricks. Cool. So, the first question I like to ask
[00:30] people who often know a lot about Databricks or sometimes know very little about Databricks, what is Databricks? What is your one-line description of what we do?
[00:43] And I can tell you it's a difficult question to answer for most, yeah? Because we are a platform and platforms are difficult to define. But, as since we can't converse in this recording, I'm
[00:56] going to give you my answer. And I for the longest time used to say Databricks is a platform to analyze data. It is high-level, but sufficiently deep to to
[01:09] to to cover end-to-end. And that means essentially bringing any data at any speed, any type into one place, which you know, we are very good at.
[01:22] Then shaping it data, transforming it in the way that works the best for you, which you know, we also very good at. And then once you have that data, presenting it and making it available to
[01:35] others so they can make decisions based on what's in there. So, that's essentially what Databricks is or maybe was because with the new things that we were implementing and bringing and enriching
[01:48] the platforms with, I started thinking, well, actually it goes farther now. Not only analyze data, but we can actually run business process in Databricks now.
[02:00] So, I started implementing some specifically in insurance. And that's actually something I wanted to show you today, the fact that we can now in Databricks implement full business process.
[02:13] And if we're talking business process, well, good example of a business process that everyone has in data in insurance is a reporting framework called Solvency, Solvency II,
[02:27] or Solvency UK if you're in the UK. So, that is um something that has been around for a while, maybe close to 15 years. Most implementations are slightly younger
[02:39] than that. But in our industry in in in IT, uh it has been a very long time. So, everything has changed. And back then, when it was implemented, we didn't have such a comprehensive end-to-end
[02:53] platforms like Databricks. So, in most places, this is stitched from many different systems, many different teams, many different data sources and data locations, and only loosely connected at
[03:05] the top level by someone overseeing the process. So, very rarely it is actually end-to-end connected with governance, with lineage, with one central view.
[03:17] So, Solvency reporting for most companies is difficult. Now, think of being that person at the top.
[03:29] And then CFO comes to you and they ask you, "What would happen to our Solvency ratio if we doubled our cyber book over the next 12 months?" And then they answer by Friday.
[03:43] So, depending on the day of the week you're watching it, it is a scary question. But the the truth is, for most companies, it would be absolutely impossible to answer by Friday. This Friday, next Friday,
[03:57] maybe even following Friday because it means doing a lot of work, going to many different teams, pulling different data from different sources, getting everyone to maybe change a little in their daily
[04:10] schedule and in their schedule of work. Because we need many many things to happen to answer that question. Now, I wanted to show you my implementation
[04:22] of Solvency II, my version, my interpretation of how it all could look like and could work if it was in Databricks. So, we can switch to my system. So,
[04:34] I have implemented end-to-end Solvency um in in Databricks. Uh so, you will have the full reporting cycle end-to-end from ingestion to reserving, capital modeling, reporting
[04:47] um templates or QRTs, ORSA, and then obviously governance and disclosure. Um most of the all of the workflows that I do, they usually start with ingesting.
[04:59] So, we make sure that we have all data in one place. Um then we have governance and control that come almost automatically with that. And then I add and enrich the workflow with AI agents because we know
[05:12] we can control them and we know we have access to the data that make them perform. So, in our um quick demo, I'm going to start with showing you end-to-end. So, if you're not a practitioner on Solvency II, and
[05:26] in most companies there are different parts of the company or different parts of the team that deal with those. Um there are three pillars. This is regulatory uh terminology. So,
[05:38] pillar number one is the capital. So, in my simple interpreta interpretation, it is the numbers that I need to get to to to report, so calculate and get to the um
[05:51] results that then I need to submit. So, in my case, I have number of reports, number of calculations that I do. Not all of them. Many many I mean, most insurers do maybe 10 to 15 QRTs or
[06:04] reports. Um they're all together about maybe 60. Uh I have uh taken some representative representative examples from um simple to complex in in in tech way
[06:17] uh and I have them here. The second part is the governance. So, once we have the numbers, we have to have the proof that the numbers are correct. So, this is about everything that we do behind the scenes to make sure that we have the numbers
[06:30] calculated and delivered correctly from correct data sources and in the correct way. And the last part is the disclosure. So, this is the part where we take all this, put it all together, and send it to the
[06:43] regulator for the submission package. So, I won't go be going through all of this. Uh it is all available. If you're interested, just get in touch with your Databricks guys or with me. Uh everything here is live, so I can click
[06:55] on all of this. It will take you to the relevant places. But, I'm in my case, in our case, we're going to uh take some shorter view at it. Uh so, first of all, uh I'm going to go into a control tower.
[07:11] So, a control tower is my central place to manage the whole process because since I have implemented everything end-to-end in Databricks, I have one central visibility of my system. So, thing number one is the solvency ratio.
[07:26] So, I can calculate my solvency ratio daily. And then for the big changes that happen, I can display labels. And it tells me what was
[07:38] the reason uh, it has changed. It has shifted so bad. So, in this case, I have some storm classic event that has changed the reality for us and that's changed my
[07:52] solvency. Now, we can look at the readiness. So, I have some attention things to look at.
[08:04] Uh, we are in quarter two. We have 27 days to report submission deadline is in um, August. Uh, I have some approvals and I have
[08:16] some highlighted here, um, challenges or issues that I need to look at that someone hasn't done, um, yet. So, everything
[08:28] that um, I can uh, everything um, in around the process is actually surfaced here for me in one place. So, first of all, is the ingestion. This is notoriously difficult for most people
[08:41] uh, because um, there are different sources of the data. They come at different speed and it's in most cases still very manual process. So, what I did here, I actually automated it all. So, my system calls and pulls the data
[08:56] whenever it becomes available fully automatically and I do some basic checks on it. So, in this case, I can see that it has done freshness. So, it has come late. I expected slightly
[09:09] earlier in my reporting cycle. It's still here, so we are fine, but it should have come about eight days earlier than it did. So, it tells me straight away
[09:21] that there is something wrong with it. I can also check the completeness which will show me how it compares to the previous uploads. Uh, I can also check the ownership. So, in this case, it's it's here. Maybe there is no panic. Just tells me it's
[09:34] late. It's not critically late, but I have also included information of who's in responsible for that. So, rather than running around and asking questions, I can just click, "Hey, Carlos, can we maybe
[09:47] ask what is going on with that?" So, that's my issue number one. Now, issue number two, my raw claims that I'm pulling from internal sources, there is something
[10:01] wrong with it. Freshness, fine. Completeness is fine. Everything is similar as it was, so nothing to flag. But, I have data quality rules as my second check, second line of defense.
[10:13] And there is something wrong. So, I have set number of checks, which are fully customizable, obviously. Grossing your positive is failing in 500
[10:26] different rows. So, there is something with the data. We can then decide whether we um decide whether we take it in, whether it's good enough for us. This um
[10:39] rows but we can drop or we can um quarantine. We can do something with them. We can obviously record them somehow. It's entirely up to you. You can set up the threshold. You know the best what works for you. But, it is automatically
[10:52] surfaced here, and we can see it. And we can see it straight away. Now, the second thing that I can see in red is my reconciliation. So, this is something that
[11:04] can be quite difficult for for for many companies because different teams work at different parts of the disclosure. So, it's difficult to see the difference between um
[11:16] QRTs. So, in my case, I have different options to do um reconciliations between QRTs. Uh we can check this one. And I can also
[11:29] this is the the agent that I wanted to show you. I have an agent here that will check everything. I mean, it has access to relevant data for this. So, it tells me that the mismatch There is a mismatch
[11:43] between these two QRTs. And then, but we don't do that that's report. And And then, it comes from still property development factors in the capital model. So, it's picked up that there was something wrong
[11:55] probably with the version. It tells us exactly what it is. So, we have the remediation and we know what to do. It also shows how we can use agents.
[12:07] Um now, the next thing I'm going to go and check my reserving because there is something happening here. There is yellow
[12:20] uh amber status. And I can see that we have some pending promotions. So, at the moment, my flow, my automated generation is stuck on PNC side because I have pending
[12:35] model approval. So, in this case, I have implemented very simple mock reserving models in Databricks directly. If you were to orchestrate external solutions, you absolutely can. We won't go into much detail here, but I have uh for um
[12:49] cat risk, I am orchestrating Igloo. That's obviously not real Igloo that I have here, but I generate inputs that would be something like Igloo takes, and I generate uh outputs that is that are
[13:02] something like Igloo creates. Similar with Profit, you can absolutely orchestrate it. We are very good at prepping data for the solutions. We are very good and very fast at consuming and sharing data from the solution. So, I can absolutely do that. Reserving,
[13:14] however, in my case, I have uh implemented in Databricks. So, the reserving models are um in MLflow in Databricks, fully managed
[13:26] in Databricks. Uh we can check the review and we can see what it does, what it tells us. But
[13:39] it sounds like the model uh that I have, so that's my new um version uh for for this year, hasn't been approved. So it tells us the description
[13:53] of what's happening. We can take it as a second set of eyes to help us decide and then in approvals we can go and check.
[14:05] And there is a pending approval, new calibra- calibration. We can then approve it and that would clear up our problem. So yeah uh promote to production if I wanted to uh
[14:18] do it. Now the next thing I wanted to quickly show you is the governance.
[14:33] as you know in Databricks, we can record a lot of things and we're actually recording everything that's happening here. So there are there is a list of recent governance events. So my standard formula promotion and other things that I have been doing.
[14:45] There is a full audit trail of everything that is happening. So you can see this is our work on different um reports. Approved, pending, you can see you can
[14:57] open audit panel, it will show you more details. Uh different approvals and um workflows and everything that's pending. Uh what is important as well, I have full AI governance. So that shows me
[15:10] everything that my agents here use uh and uh create for us. So if someone was using agents to make some decisions, we don't have agents actually making any
[15:22] decisions for us. They only offer recommendations and second set of eyes, but we can we can see from here what was happening and we can very quickly see what has influenced the person approving the process.
[15:35] Right, so talking about agents, I have implemented quite a few of them. There will be more that you will see in a moment, but I have
[15:47] I usually build something like that in my processes. So, there is a number of agents that do different things in the platform. They have all fairly narrow scope and access to narrow amount of data only for what is relevant for their
[16:01] work to do. There is full control, obviously. Everything is recorded. Everything you can customize and change. And it's very easy to change the back end if you were to use different models. In this case, I
[16:14] have six agents and Genie, so I can also ask questions about my data and tables to tell me what was actually what's happening in my
[16:26] data sets. Now, in this view, I have everything behind what we call a supervisor. That means I can ask general questions that will be spanning different agents. So,
[16:40] if the question is asked, the supervisor will decide whether it can answer using one or many agents and it will correctly send it to where it can be
[16:53] answered. So, I've asked in this case what is outstanding for Q4 close and it gives me full overview of our state.
[17:13] I will show you two more pieces. I mean, we have actually skipped this thing, so maybe we can look at simple Q orchestrator, so you it will show you where you are blocked and what is um the reason for that. So, everything's
[17:26] life here, you can click on it and see uh to what do you need to do to unblock it. But, I wanted to show you two more things before we close this. So, ORSA ORSA is one of the reports uh that are also required. Most
[17:42] companies do it only once a year uh because it's a difficult one. So, unlike the QRTs, which are typically numerical, this is not just numbers, this is a narrative. So, um your actuaries typically will type it in
[17:55] and it takes significant significant amount of work to do that. Now, in my case, I have obviously used LLMs to do that. So, I can create my ORSA every night.
[18:08] So, based on the numbers that I have right now correct. So, this is the example uh you can do uh different stress and scenario testing, which is also implemented if
[18:20] you're interested, so we can do that. But, currently uh you can run it with the LLMs overnight and that's something that gives you quick overview of where we are, so it is not a surprise to anyone when it's finally uh created and checked
[18:34] by your actuaries. Uh and then last thing, what about our question? So, we were asked about doubling our cyber book over the next 12 months. So, I've actually implemented
[18:47] this scenario and two more. So, I can ask that question and it runs the projection behind the scenes in Databricks. So, choosing jobs and everything is actually running in
[19:00] Databricks that that that we see it's a thin layer application with some caching actually to make it faster, but everything's implemented for real. So, now our question, if we were to implement this end-to-end and automate
[19:14] it in the system like Databricks, we can actually implement processes to answer question like this. So, what would happen to double cyber book over 12 months?
[19:26] We have quick answer, this would happen, but this is not enough for us. I mean, I also have here another agent running, Contrarian Capital Reviewer, which is set up to give you alternative point So,
[19:41] you can go back to your CFO and tell him, "Yeah, it's actually not that bad when you look only at the solvency ratio, but as a matter of fact, it brings a lot
[19:53] of challenges. So, we would have to change a lot of things if we were to do it. So, there are different pushbacks. You can take them, you can read them, and uh maybe use them. But that's another example of how
[20:06] um the agents can be used. Right. So, that's um um that's the end of the demo. Quickly, what just happened? So, cyber book
[20:19] doubling, we answered the questions in minutes, not in days, if it was to be implemented like this. You can absolutely automate it uh and and and run this type of scenarios in no time.
[20:32] Uh we can see the current status, late feeds, and blockers, one single control view covering the whole end-to-end process. Our summary narrative, it writes itself nightly.
[20:45] You can do it as often as you want. Everything that we have here is governed and audit trailed. So, everything is recorded about the process. You can then surface it in uh any way you want.
[20:57] And then it all runs on Databricks with friends. In this case, I have used some examples of integration with other softwares.
[21:09] So, the next question, the second big question to you, what is your great idea? And this is just obviously visionary example of what can be done. I wanted to ask you, what do you want us
[21:21] to do for you? So, come to us with the big questions. Don't ask us about Don't ask me about the databases. Ask me about how can we build something interesting on Databricks and make your
[21:34] life easier. So, there is a lot of value in the market today. I won't spend much time on this slide, but we do quite a lot of this. So, on the make money side, pricing is quite busy. So, we're building Databricks processes
[21:48] on pricing. Underwriting obviously because it's complex and it brings a lot of data in one place and making it available make underwriting easier. Same with claims, that's a save money
[22:00] case. So, automated triage and fraud and everything like that. We can I also have examples on claims. If you're interested, please do reach out. Mandatory, one example that I have given you is actually Solvency II, so mandatory reporting. This is something
[22:13] that also people want to automate and make easier. So, connect with me on LinkedIn. This is me, Lawrence. I build this type of solutions. I will very quickly
[22:26] flick another or other other options that we have. So, we have Solvency pricing. I'm working on some wrap-around for your capital modeling or
[22:40] catastrophe modeling solution. So, how to fit and consume data from those. I have some entry into claims, entry insurance, and SAS Excel migrations. That's interesting and important for
[22:52] everyone. More coming. So, if you have any ideas for those type of workflows, please do come to us. We will be very happy to help you. Thank you very much.
Learn more about the Databricks Data and AI platform.
The information provided herein is for general informational purposes only and may not reflect the most current product capabilities or configurations.